Office software is closely linked to the PDF,the PDF is also must have to control!
Set home Page Add to Favorites
|
Second, rapid statistical distribution of student test scores students in the use of examination results, it is often necessary to statistics of the scores of students above the distribution of examination results, if we adopt the method described below, we can make this work has become very convenient.
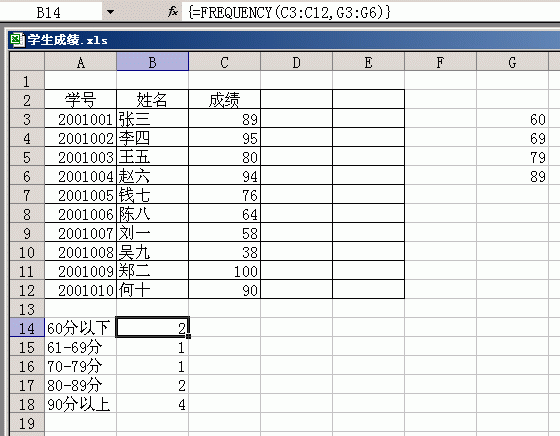
1, open the worksheet student achievement (in this case are still cases of the use of the worksheet, format see figure 1).
2, in cell G3 to G6 entry test scores of students of the Statistics sub-points. In this case, such as the use of sub-point statistics: 60,69,79,89, or 60 hours following statistics ,61-69 ,70-79 ,80-89, more than 90 points in five sections of students in examinations The distribution of the number, of course, you can according to their actual needs in different settings here.
3, selected to design the range formula B14 to B18, press the F2 key, input the formula "= FREQUENCY (C3: C12, G3: G6)", because the formula is an array formula, in the entry END above, they are required to press "Ctrl + Shift + Enter" key, for the content of the above formula together with an array formula that is marked in brackets "{}"ĄŁ
4, when the operation is complete, in B14 to B18 cells have been rapidly correct the distribution of student test scores (Figure 3).
 5, it is worth noting that, in our statistics section design, this statistical statistical sub-section than the number of data points, one more. More from this section that the statistical value in excess of the maximum number of intervals. For example, in this case, we have designed the statistical sub-point of the four 60,69,79,89 value, then get the correct statistics to the distribution of the data section, it is necessary to B14 to B18 in the five cell input FREQUENCY () function's calculation, more than out of a cell performance of their students will return to the table more than 90 the number of points. |