Office software is closely linked to the PDF,the PDF is also must have to control!
Set home Page Add to Favorites
|
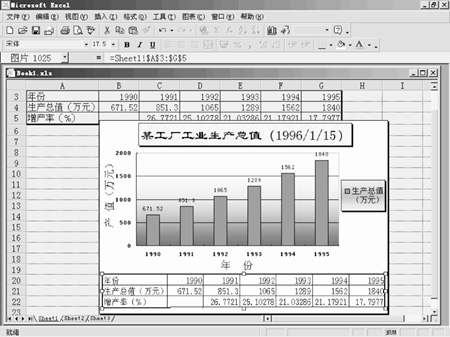
Selected in our example, the chart output only, and does not increase the rate. In order to look at the chart to know when the production rate at the same time, we can insert data in chart form, and the establishment of links and data sources. In the image and data links between, you can make the location data table have a certain flexibility. The specific method is, by the usual method, to generate a chart, and then operation of the following steps: * Want to use the mouse to select the data to generate charts, press [Shift] key, select [Edit] column [Copy Image], if we do not press the [Shift] key or shortcut keys [Ctrl + C] to copy only data; * Check the chart with the mouse click, and then paste (Edit menu with the [Paste] or [Ctrl + V]), do not paste the picture link and data region; * Use the mouse to select picture, click the formula bar, type an equal sign and link the formula "= Sheet1! $ A $ 3: $ G $ 5", shown in Figure 8. And then enter, complete the picture and data on the dynamic-link region. 
Figure 8
cut off the charts and numerical District link As mentioned above, change the data in the data, the chart will automatically update. However, in some cases, it may want to chart the region with its separation of data into a static chart. For example, a factory to 2-12 Monthly production of various products in January and the production of various products are compared, this time on the need to produce a raw data from the chart, that is, the January production of the charts. There are two ways to create static charts: 1, a copy of the original chart. With the mouse to select the chart, select [Edit] menu bar of the [Copy] command, and then hold down the [Shift] key, then select [Edit] menu bar of the [Paste] command (If you do not hold down the [Shift] key, then generates chart with links to the original data remains). 2, will chart the value is converted to the specific array region. Chart with the mouse to select the corresponding data series, and then delete formula links to the formula bar, cutting off relations link, then this series is a corresponding data source generated by an array of values, but no longer exists between the data source link relations. The same method can be used in other series set to static. |